
Since the year is not quite over it is hard to celebrate crossing that finish line, but the end is in sight. I can officially say I almost finished my first year as a literacy coach. This first part of my new journey brought many celebrations, along with much new learning. Most of the new learning was great, and of course there are things you wish you did not learn. (Sometimes the digger you deep the messier things get.)
A lot of my celebrations this year happened as a team. Sometimes my team was a group of teachers, a student, or a building-level team, but all the same, a sweet celebration. I was searching my mental list of celebrations and tried to find one that was all on my own. I did not want to take away any credit away from the team by putting up my own celebration for all to see in the blogging world. But individual celebrations do not happen very often though in a coaching role-- imagine that!
Though this was not one of the bigger things that happened this year, it was my own celebration. I went into this role, yes I admit, a little scared about all the data I would encounter….and the spreadsheets I would have to make...and the conclusions I would have to draw from all these numbers. I can say at the end of this year I have jumped into the world of Excel and even led discussions on data. (Gasp!)
Here are two examples from my celebration:
One. I found this wonderful list of questions to help make data discussions more student-centered in Diane Sweeney’s book, Student-Centered Coaching at the Secondary Level.
Guiding Questions for Data Analysis
- What does the data reveal? Highlight the 3 - 5 most significant data points or trends - red flags - that you see in this set of results?
- What questions does the data pose? For each red flag that you identified, generate 2 - 3 questions that the data raises for you.
- What might explain the data? For each red flag you identified, jot down any theories you have about causes/explanations for the data.
- What will we do about it? For each red flag, identify instructional strategies to improve student achievement.
Sweeney, D. (2013). Student-centered coaching at the secondary level. Thousand Oaks, CA: Corwin.
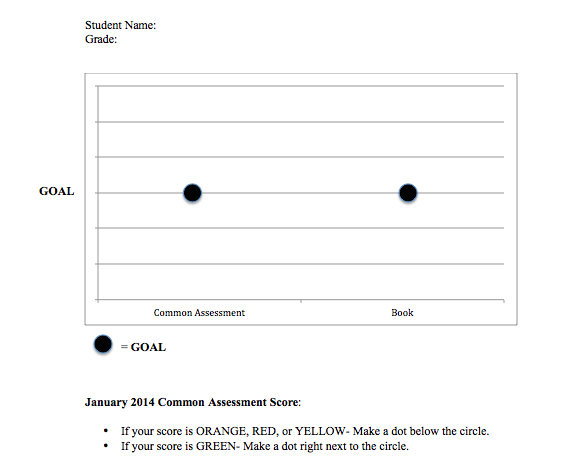
Two. My building-level school improvement team discussed how we would share the data for school-wide common assessment. I already had the data in spreadsheets and learned how to do a mail merge, so we could get students their individual scores. As a team we decided this would be distributed in homeroom. I worked on the format for the summary sheet that would go out to students. Here is what the summary sheet included:
- Scores: A few team members felt strongly about having colors versus numbers for the score. They did not want students to focus on their number alone. We discussed a way to attribute a color to the score and to graph it on what the goal score (proficient) would be.
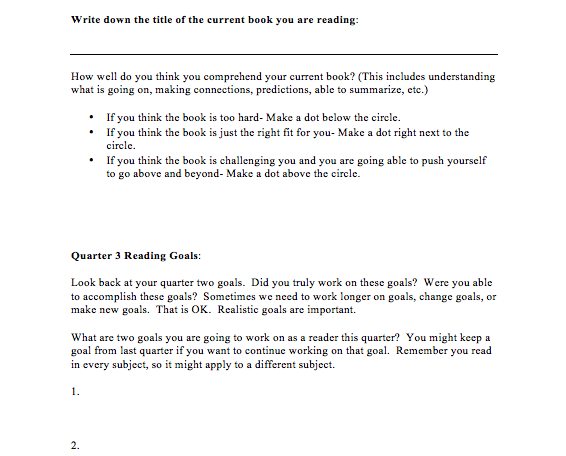
- Current Book: I felt it was important, after including two reading assessment scores, to also focus on a current choice book for a hopefully positive score on the graph. Students self-evaluated their comprehension of a choice book.
- Goals: Student chose two reading goals for the quarter. There was one quarter where the assessments happened fairly close together, so I included a reflection section on their goals.
Here is an example of one of the summary sheets:
No comments:
Post a Comment
Comments are moderated. Your comment will appear after approval by this blog's editor.